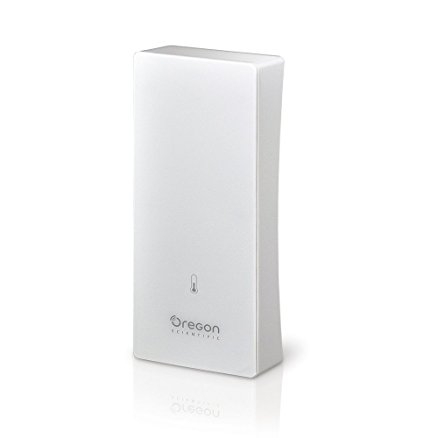
Oregon Scientific RTGN129 is a remote temperature and humidity sensor designed to be used with Oregon’s PRYSMA series stations.
It uses the standard 433MHz band so we can tune our RTL-SDR USB dongle to receive their signal. But how to decode it?
There are plenty of documentation about decoding Oregon’s devices, and Benjamin Larsson’s rtl_433 tool may decode many of 433.92MHz devices but, unfortunately, it didn’t support the RTGN129.
This is the great opportunity to skill myself in reverse-engineering of an “unknown” signal, so I decided to implement it into rtl_433 (Merged pull request: https://github.com/merbanan/rtl_433/pull/634).
From RTGN129 datasheet we have the confirmation that this device transmits at 433MHz.
Oregon uses several protocol versions (v1.0, v2.1, v3.0) so, first of all, we need to discover if our RTGN129 uses one of these. Protocol documentation are here and here.
Instead of using directly rtl_433 in analyze mode (-a flag), we’ll pretend it does not exist and we’ll go down to low level just for fun. A sort of simulated black-box approach.
There are several tools in the wild to analyze the radio signal from an RTL dongle, but one of the best, IMHO, is baudline.
You can use it in the “hacker’s way”, for example:
FR="433.944e6"; SR="2.5e6"; \
rtl_fm -f $FR -s $SR -g 30 -M am | \
baudline -reset -flipcomplex -samplerate $SR \
-basefrequency $FR -channels 2 -quadrature \
-format u8 -fftsize 2048 -stdin
First of all, we need to find the right PPM value to use in the next commands to calibrate our dongle.
rtl_test -p
So we can find the exact frequency of RTGN129 starting from the 433.92MHz:
FR="433.92e6"; SR="2.5e6"; \
rtl_sdr -p 130 -f $FR -s $SR -g 30 - | \
baudline -reset -flipcomplex -samplerate $SR \
-basefrequency $FR -channels 2 -quadrature \
-format u8 -fftsize 2048 -stdin
Where -p is our PPM, -f is the tuned frequency, -s is the sample rate, and -g is the gain (0 for auto). The last “-” before the pipe stands for “stdout”.
433.92e6 stands for 433.92 * 10^6 so 433.92MHz that is more readable than 433920000.
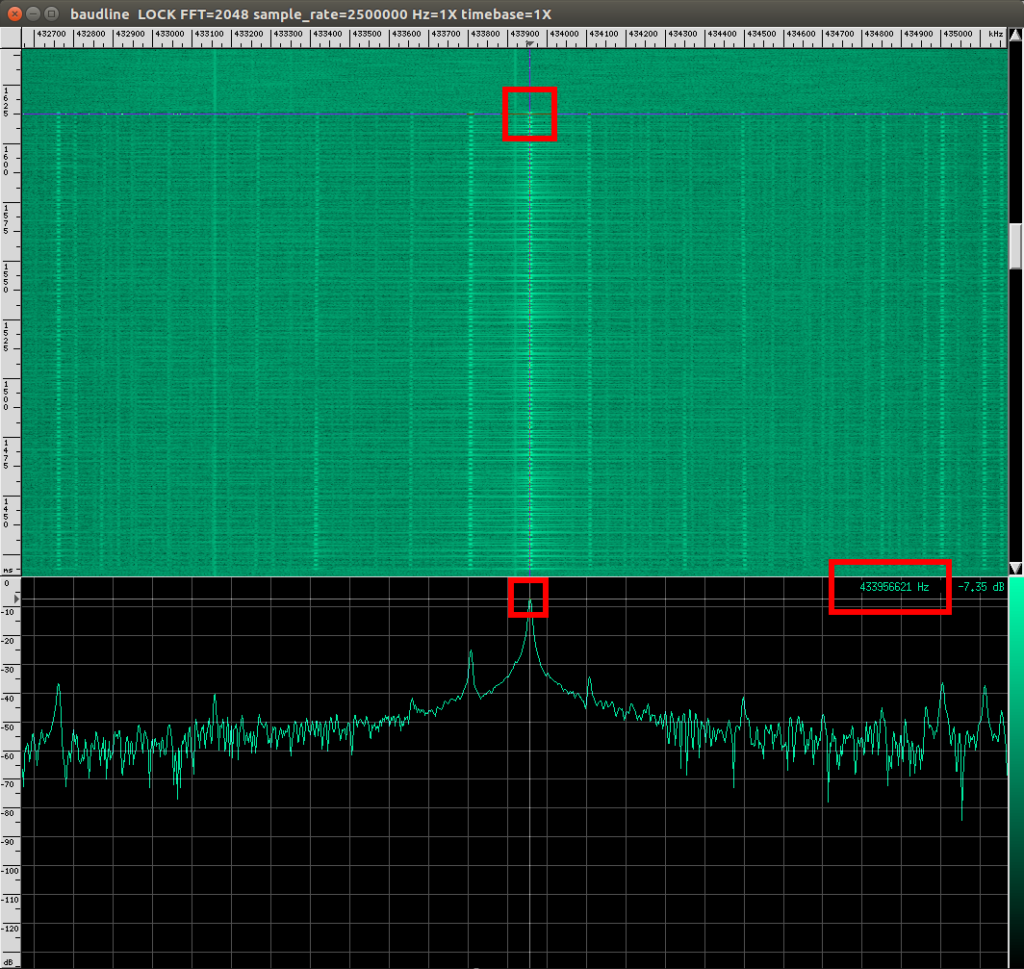
The above command shows you the baudline window. When you see the burst passing in the spectrogram press “pause” on your keyboard, center the signal in the spectrogram area (green background) with the mouse, than center it in the spectrum analyzer (black background) and read the exact frequency on the bottom-right area: 433.95Mhz
Right click on the spectrogram area, then select display, then click wafeform. Now we can see the waveform of the signal in the time domain. To zoom in/out you may use ALT + right and left arrows.

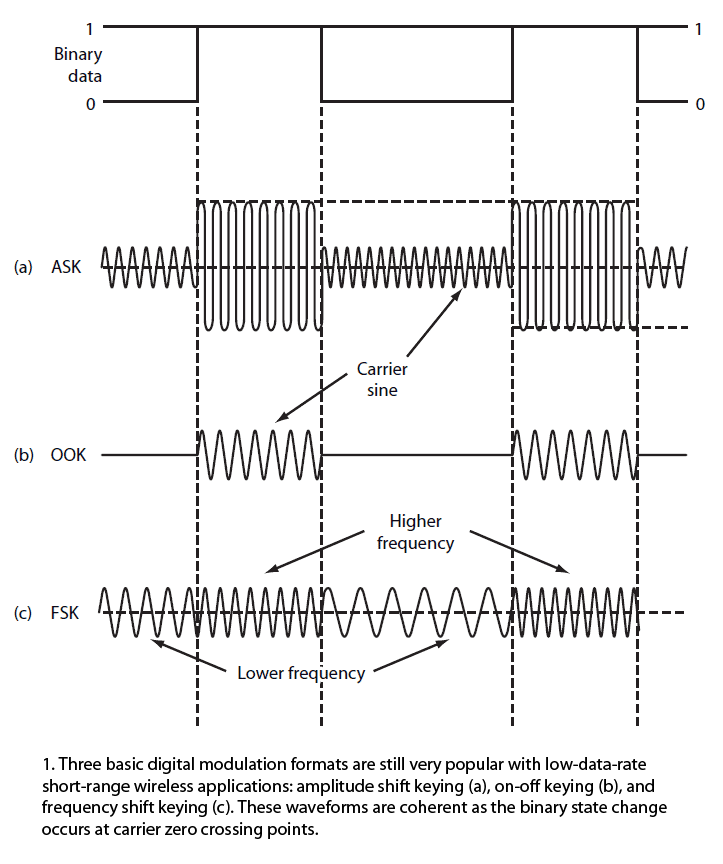
Navigating the waveform we notice that, when the signal is present, the frequency and the amplitude stills the same, and there are silence between two signal, just like in the On-Off Keying!
Basic digital modulation formats:
Now we use “rtl_fm” instead of “rtl_sdr” to demodulate the signal using AM demodulator:
FR="433.95e6"; SR="2.5e6"; \
rtl_fm -f $FR -s $SR -g 30 -M am | \
baudline -reset -flipcomplex -samplerate $SR \
-basefrequency $FR -channels 2 -quadrature \
-format u8 -fftsize 2048 -stdin
and finally visualize the demodulated bits!

If we decode it as “Manchester code” we read:

Instead of frustrating us overlaying red lines in gimp, as I did with the above image, we can use Universal Radio Hacker to decode the stream!
(to be continued …)

